.png)
How to calculate cost-per-screen with AI

March 15, 2026
How to Calculate Cost-Per-Screen with AI
The metric your TA dashboard is almost certainly missing — and why fixing it changes how you staff, budget, and justify every recruiting tool you buy.
There's a number that almost every recruiting leader tracks religiously: cost-per-hire. It shows up in board slides, QBRs, and annual HR reports. It's the metric that sounds complete — because it's, well, a cost, and it ends at the hire. Job done.
Except it isn't complete. Not even close.
Here's the uncomfortable truth most TA teams don't want to sit with: the majority of your recruiting spend evaporates long before a single offer is made. It burns inside the screening stage — the hundreds of résumés reviewed, the phone calls that go nowhere, the hours your recruiters spend on candidates who were never going to make it past round one. Cost-per-hire doesn't capture any of that waste. It waits until the end of the funnel and then gives you an average. By then, the inefficiency is already baked in.
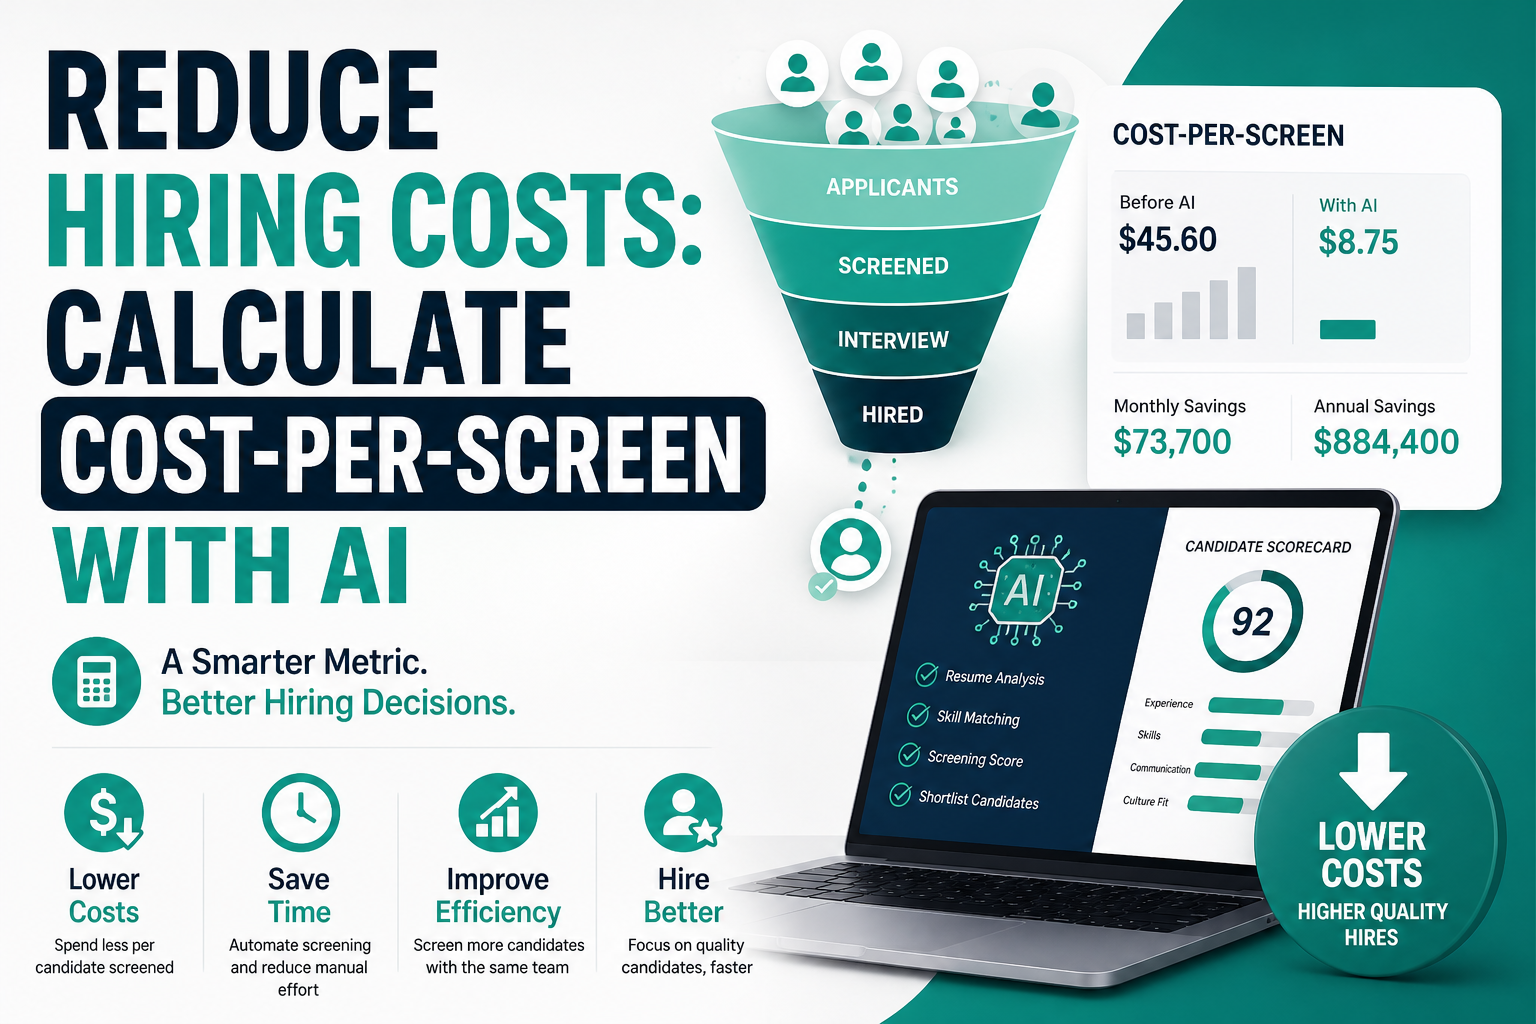
Cost-per-screen is the metric that actually tells you where the money is going. If you're a TA leader, a staffing firm owner, or a founder trying to stretch a lean recruiting budget, understanding this number — and knowing how to reduce it with AI — is probably worth more than any tool you'll evaluate this quarter.
Let's break it down properly.
Why cost-per-hire is misleading (and what it hides)
Cost-per-hire has been the industry standard for decades because it's easy to calculate and easy to benchmark. SHRM puts the average somewhere between $4,700 and $28,000 depending on seniority and sector. That range tells you almost nothing useful, but it gives procurement teams a target to shoot at.
The structural problem with cost-per-hire is that it's a trailing metric. It captures the total spend of a completed search and divides it by the number of people hired. That's an average across all efficiency and inefficiency in the process — including all the screening work that happened on candidates who were never going anywhere. A recruiter who screened 400 candidates and hired one person looks identical to a recruiter who screened 40 candidates and hired one person, at least from a cost-per-hire perspective.
The second issue: cost-per-hire is a funnel-end metric, which means by the time you see the number, the damage is already done. You can't use it to identify where in the process your spend is leaking. Was it job boards? Sourcing time? Phone screens? Assessment tools? The rolled-up number erases all of that.
And third — and this matters a lot if you're evaluating AI tools — cost-per-hire doesn't cleanly reflect the impact of process improvements in the screening stage. You can cut your screening time by 60% with an AI tool, and if the rest of your funnel stays the same, cost-per-hire might barely move. That doesn't mean nothing improved. It means you're measuring at the wrong level.
The metric you actually need is upstream. It lives at the screen.
"Most teams don't have a hiring cost problem. They have a screening efficiency problem."
— A pattern seen across hundreds of TA auditsWhat is cost per screen in recruiting?
Cost-per-screen is the total cost your organization incurs to evaluate one candidate at the screening stage — from the moment a résumé or application hits your pipeline to the point where a recruiter makes a pass/advance decision.
It's not the cost of a phone call alone. It's the full loaded cost of everything that goes into that screening decision: recruiter salary time, the portion of tool licenses used, any AI or ATS costs allocated to the screening stage, and the indirect overhead of coordination. When you calculate it correctly, it gives you a unit economics view of one of the most labor-intensive parts of recruiting.
Think of it like this: cost-per-hire is your CAC (customer acquisition cost) as a recruiter. Cost-per-screen is your cost per lead qualification. In any growth operation, you'd obsess over both — but especially the qualification stage, because that's where volume is highest and efficiency gains are most dramatic.
A well-run recruiting team might screen anywhere from 20 to 150+ candidates per role depending on the function and sourcing channel. If each screen costs you $40 and you're running 50 concurrent searches, you're looking at a six-figure monthly line item that never appears as its own category in your budget.
How do you calculate cost per screen?
The formula isn't complicated, but getting the inputs right takes some honest accounting. Most teams underestimate the real cost because they only count direct spend and ignore loaded recruiter time.
Let's define each component:
- Recruiter Time Cost: Your recruiter's fully loaded hourly rate multiplied by the average time spent per screen. "Fully loaded" means base salary + benefits + employer taxes — typically 1.25–1.4x base. Don't use base salary alone; you'll undercount by 30%.
- Tool Cost: The per-seat monthly cost of your ATS, sourcing tools, video interviewing platform, and assessment software — allocated proportionally to the screening stage. If screening represents 40% of a recruiter's work, allocate 40% of their tool costs here.
- Overhead: A small overhead allocation for things like recruiter manager review time, coordination with hiring managers, and administrative time logging candidates. Often 10–15% of recruiter time cost.
The output is a per-unit cost — what it actually costs your team, in real dollars, to form a pass/no-pass opinion on one candidate. It's the kind of number that makes CFOs pay attention.
Breaking down where the cost actually lives
Before you run the numbers for your own team, it helps to see what a realistic cost breakdown looks like. The proportions shift by company size and role type, but this gives you a reasonable structure to audit against.
| Cost Component | Example Input | % of Total Screening Cost | Notes |
|---|---|---|---|
| Recruiter time (résumé review) | 6 min/résumé @ $38/hr | 40–50% | Largest single cost; highest AI reduction potential |
| Recruiter time (phone screen) | 25 min/call @ $38/hr | 25–35% | Not always done at screen stage; varies by role |
| ATS / HRIS cost allocation | $180/seat/month, 40% to screening | 8–12% | Often ignored in cost-per-screen estimates |
| Sourcing tool allocation | LinkedIn Recruiter, Indeed, etc. | 5–10% | Allocate the portion used in the funnel pre-screen |
| Manager review time | 1–2 min/candidate shortlist review | 5–8% | Usually untracked; add 10–15% overhead buffer |
| AI screening tool cost | $0.50–$2.00/candidate (if applicable) | Variable | Replaces recruiter time cost; net effect is a large reduction |
You'll notice that recruiter time — especially résumé review time — dominates this cost structure. That's exactly why AI has such an outsized impact on this specific metric. When you automate the résumé review layer, you're eliminating the largest cost component directly.
A worked example: logistics company hiring at scale
Theory is fine. Let's make it concrete. Here's a realistic scenario from a mid-sized logistics and warehousing company hiring for driver, warehouse associate, and operations coordinator roles — roughly 200 hires planned for Q2.
Recruiting team: 4 in-house recruiters, 1 TA manager
Average recruiter fully loaded rate: $38/hr ($72K base × 1.3 loaded)
Average time to review + disposition one résumé: 6 minutes
Average phone screen time (for advancing candidates): 22 minutes
Phone screen rate: 1 in 5 résumés reviewed advances to phone
Applications received per role: ~80 (range: 40–160 depending on channel)
Total applications to screen across all roles: ~3,200/month
Tool cost allocation (ATS + sourcing, to screening stage): $280/recruiter/month
Step 1 — Résumé review cost
3,200 résumés × 6 min = 19,200 minutes = 320 recruiter-hours
320 hours × $38/hr = $12,160/month
Step 2 — Phone screen cost
3,200 résumés ÷ 5 = 640 phone screens
640 screens × 22 min = 14,080 minutes = 234.7 recruiter-hours
234.7 hours × $38/hr = $8,919/month
Step 3 — Tool cost allocation
4 recruiters × $280/month = $1,120/month
Step 4 — Overhead (10%)
(12,160 + 8,919) × 0.10 = $2,108/month
Total screening cost
$12,160 + $8,919 + $1,120 + $2,108 = $24,307/month
Cost-per-screen
$24,307 ÷ 3,200 candidates = $7.60 per screen
Now here's what that same number looks like if the company deploys an AI screening tool that handles résumé review and initial candidate qualification automatically — reducing recruiter review time by 75%:
| Cost Component | Before AI | After AI | Savings |
|---|---|---|---|
| Résumé review (recruiter time) | $12,160 | $3,040 | $9,120 |
| Phone screens (recruiter time) | $8,919 | $5,351 | $3,568 (AI pre-qualifies, reduces screen volume) |
| AI tool cost (per candidate) | $0 | $1,600 ($0.50 × 3,200) | -$1,600 |
| Tool + overhead | $3,228 | $2,900 | $328 |
| Total monthly | $24,307 | $12,891 | $11,416 saved/month |
| Cost-per-screen | $7.60 | $4.03 | 47% reduction |
That's $137,000 saved annually — on one company of four recruiters. The AI tool in that scenario costs $19,200/year. The net ROI is approximately 6x, and that's a conservative model that doesn't even account for the reduction in time-to-fill or the quality improvements from more consistent screening.
The numbers behind screening inefficiency
This isn't an abstract problem. Here's what the data looks like across the industry:
The last stat is the one worth sitting with. If 75% of your candidates never get past screen, then three-quarters of your per-candidate spend is, effectively, elimination cost. You're not paying to hire people — you're paying to rule people out. The question is: how efficiently can you do that?
Recruitment benchmarks by industry: what good looks like
One of the most common questions TA leaders ask when they first calculate their cost-per-screen is: "Is this normal?" Here's a rough benchmarking table by industry. These are estimates based on typical application volume, average recruiter compensation, and tool usage — they're directional, not authoritative.
| Industry | Avg Apps per Role | Manual CPS Estimate | AI-Assisted CPS Estimate | Potential Saving |
|---|---|---|---|---|
| Logistics / Warehousing | 60–120 | $6–9 | $3–4.50 | 40–50% |
| Retail / Hourly Staffing | 80–200 | $4–7 | $2–3.50 | 45–55% |
| Technology / SaaS | 100–400 | $9–15 | $4–7 | 40–55% |
| Healthcare | 40–90 | $12–22 | $6–11 | 40–50% |
| Finance / Professional Services | 80–250 | $10–18 | $4–8 | 50–60% |
| Manufacturing | 50–150 | $5–8 | $2.50–4 | 40–50% |
| Staffing Agencies (general) | 100–500+ | $3–6 | $1.20–2.50 | 50–65% |
For staffing agencies and high-volume employers, cost-per-screen improvements are especially dramatic because the absolute volume is so high. A staffing firm processing 5,000 candidates a month at even $4/screen is burning $20,000/month on screening alone. Cutting that to $1.60 with AI saves $11,000 monthly — before any other efficiency gains.
Cost-per-hire vs cost-per-screen: a direct comparison
These aren't competing metrics — they measure different things. But understanding how they relate (and why CPS deserves equal billing) is important for any TA leader trying to make data-driven decisions.
| Metric | Cost-Per-Hire | Cost-Per-Screen |
|---|---|---|
| What it measures | Total recruiting spend per completed hire | Cost to evaluate one candidate at screen stage |
| Funnel position | Bottom of funnel (trailing) | Top of funnel (leading) |
| Visibility into waste | Low — averages out inefficiency | High — exposes screening cost directly |
| Actionability | Hard to optimize in-flight | Easy to benchmark and reduce week-over-week |
| AI impact visible? | Indirect, delayed | Direct and immediate |
| Useful for board reporting? | Yes — outcome metric | Yes — operational efficiency signal |
| Frequency of calculation | Per hire / quarterly | Weekly / per requisition |
| Reflects process quality? | Partially | Directly |
The practical implication: you should be tracking both. Cost-per-hire as your strategic outcome metric, cost-per-screen as your operational health signal. When CPS creeps up, it's a leading indicator that something is breaking in your pipeline — volume is spiking, your screening criteria is unclear, or your team is wasting time on unqualified candidates who should have been filtered out earlier.
How AI actually reduces cost per candidate screening
There's a lot of noise right now around AI in recruiting. The more useful question isn't "does AI work?" but rather "where specifically does it reduce cost-per-screen, and by how much?"
The reduction happens across three distinct layers:
Layer 1: Automated résumé review and initial ranking
This is the single highest-impact intervention. Instead of a recruiter spending 6 minutes per résumé, an AI tool processes each application in seconds — parsing job-fit signals, flagging must-have criteria, and generating a ranked shortlist. The recruiter still makes the final call, but they're working from a curated list of 10–20 candidates instead of wading through 80–120 raw applications.
The labor saving here is roughly 70–80% of the résumé review cost component, which — as we saw above — is the largest single input. On a 100-application role, this is the difference between 10 recruiter-hours and 2 recruiter-hours, just in the intake layer.
Layer 2: AI-assisted or fully automated initial screens
Some AI tools (including NinjaHire) conduct structured asynchronous video or voice screens automatically — asking role-relevant questions, capturing responses, and surfacing scored summaries for recruiter review. This eliminates the live 20–30 minute phone screen for the initial qualification pass.
The labor saving is significant: a 22-minute phone screen that costs $14 in recruiter time gets replaced by a $0.50–$2.00 AI interaction. For a team running 500 screens a month, that's a $6,000–$6,750 monthly difference from one change.
If you're comparing tools for this specific use case, it's worth looking at how NinjaHire compares to HireEZ or how the screening automation in NinjaHire stacks up against Tenzo AI — especially for high-volume or agency use cases where this cost layer is most significant.
Layer 3: Reduced coordination and follow-up overhead
A quieter savings category, but real. AI tools that handle scheduling, reminders, status updates, and candidate communications reduce the invisible admin load around screening. Recruiters stop losing 20 minutes to scheduling back-and-forth per candidate. Over a month of active screening, this adds up to hours per recruiter per week — labor that's now redirected to high-judgment work.
Tools like NinjaHire vs HeyMilo differ in how much of this coordination layer they automate versus how much they focus purely on the conversation quality of AI screens. Worth evaluating both dimensions depending on where your team loses the most time.
"The ROI of an AI screening tool isn't in what it does. It's in how many recruiter-hours it frees up for work that actually requires human judgment."
— Operational pattern across TA teams using AI at scaleCalculating AI recruiting ROI from your cost-per-screen number
Once you've calculated your baseline CPS, the AI ROI calculation becomes straightforward. Here's the framework:
Let's apply this to a mid-sized tech company screening 1,200 candidates/month:
| Input | Value |
|---|---|
| CPS before AI | $12.50 |
| CPS after AI deployment | $5.80 |
| Monthly screening volume | 1,200 candidates |
| Monthly cost savings | ($12.50 − $5.80) × 1,200 = $8,040 |
| AI tool cost (monthly) | $1,200 |
| Net monthly savings | $8,040 − $1,200 = $6,840 |
| Monthly ROI | 570% |
| Annual net savings | $82,080 |
This is exactly the kind of number that turns a budget conversation from "can we afford this?" into "can we afford not to?" When you anchor the conversation in cost-per-screen — a measurable, auditable metric — the business case writes itself. Compare that to trying to justify AI based on cost-per-hire improvements, which are slower to materialize and harder to attribute.
If you want to benchmark your numbers specifically, tools like NinjaHire vs LinkedIn Recruiter offer meaningful comparisons on where cost savings actually come from at the screening stage versus the sourcing stage.
Common mistakes when calculating cost-per-screen
A few things that tend to go wrong — either making your CPS look better than it is, or making the math too complicated to be useful:
- Using base salary instead of loaded rate. This is the most common error. A $75K recruiter doesn't cost you $36/hr — it's closer to $45–48/hr once you account for benefits, employer taxes, and overhead. Undercosting recruiter time will understate your true CPS by 25–35%.
- Not counting phone screen time separately. Some teams lump résumé review and phone screens into one "screening" bucket. You'll get more useful data — and more precise AI ROI measurement — if you track these as separate cost components.
- Ignoring tool costs. Your ATS, your LinkedIn Recruiter license, your video interview platform — a portion of these should be allocated to the screening stage. It's not a huge number, but skipping it creates a blind spot in your total cost picture.
- Calculating CPS at the company level only. Aggregate CPS will mask significant variation by department, recruiter, and role type. A tech team's CPS might be 3x the CPS for hourly roles. Segment your data, or the number loses most of its diagnostic value.
- One-time calculation, never revisited. CPS is a living metric. It changes as volume changes, as your team composition shifts, as you add or remove tools. Recalculate it monthly or quarterly at minimum.
- Not accounting for the cost of poor screens. A bad screen — a candidate who advances who shouldn't have — costs you downstream interview time, hiring manager hours, and team attention. Your true cost-per-screen should eventually include some allocation for downstream waste caused by screening errors. AI typically improves screening consistency, which reduces this hidden cost.
How to present cost-per-screen to leadership
There's a real skill to making this land with a CFO or a VP of Operations who's never seen CPS as a line item. Here's what tends to work:
Start with a number they already know. Don't lead with CPS — lead with your annual recruiting budget or your cost-per-hire. Then show the breakdown: "Here's where that budget actually goes by stage." When they see that 35–40% of recruiting spend is consumed at the screening stage, you have their attention.
Show the before/after projection. Use the formula above to model what your CPS looks like today versus what it would look like with an AI tool. Translate it to monthly and annual savings. Anchor to headcount: "At our current hiring volume, this is the equivalent of one full recruiter FTE's cost per year."
Connect it to capacity. Beyond cost, CPS improvements translate directly into recruiter capacity. A recruiter spending 30% less time on screening can handle more requisitions — which means you scale volume without headcount. That resonates with any leadership team trying to grow efficiently.
Show the quality angle. AI screening tools don't just reduce cost — they apply consistent criteria across every candidate, reducing the impact of recruiter fatigue and unconscious screening bias. That's a quality and compliance argument that matters to HR leadership independently of the financial case.
Full hiring funnel cost analysis: seeing the complete picture
Cost-per-screen matters most when you see it in the context of the full funnel. Here's a typical recruitment cost breakdown across all funnel stages, showing where screening sits relative to other cost layers:
| Funnel Stage | Typical Cost Range (per hire basis) | % of Total CPH | AI Reducibility |
|---|---|---|---|
| Job advertising / sourcing | $300–$2,500 | 15–25% | Medium |
| Application processing / ATS | $50–$300 | 3–8% | High |
| Screening (résumé review + initial calls) | $400–$2,800 | 25–40% | Very High |
| Structured interviews | $500–$3,500 | 20–30% | Low–Medium |
| Assessments / references | $100–$800 | 5–12% | Medium |
| Offer + onboarding admin | $200–$1,200 | 5–10% | Medium |
The screening stage is consistently in the top two cost buckets — and unlike interview costs (which are hard to cut without impacting quality), screening costs are highly automatable. That's the combination that makes this the highest-priority efficiency target in the funnel.
Getting started: the practical steps to track CPS in your org
You don't need a complex analytics setup to start measuring cost-per-screen. Here's how to get to a working number in under a week:
- Pull your ATS data for the last 30 days. You need: total applications received, number of candidates advanced past screen, and number of requisitions active during that period.
- Time-track one week of recruiter screening activity. Ask each recruiter to log actual time spent on résumé review and phone screens for 5 days. You want a realistic per-candidate average — not an estimate from memory.
- Calculate fully loaded hourly rate. Take annual salary, multiply by 1.3 for a conservative loaded cost estimate, divide by 2,080 work hours/year.
- Allocate tool costs to screening. Look at your ATS and sourcing tool invoices. Estimate what percentage of recruiter workflow is screening-related (usually 35–50%). Apply that ratio to monthly per-seat costs.
- Run the formula. Add up your monthly screening costs (time + tools + overhead), divide by total candidates screened. That's your baseline CPS.
- Segment by role type. Run the same calculation separately for your highest-volume role categories. The variation will tell you where optimization effort pays off most.
Once you have a baseline, you have a benchmark. Every process change — a new screening tool, a revised criteria framework, an AI deployment — can now be measured against a real number rather than a gut feeling.
Frequently asked questions
What is cost per screen in recruiting?
Cost-per-screen (CPS) is the total cost your organization incurs to evaluate one candidate during the screening stage of the hiring process. It includes recruiter time for résumé review and initial interviews, allocated tool costs (ATS, sourcing platforms), and overhead. Unlike cost-per-hire — which captures total spend across the full hiring process — CPS is a mid-funnel metric that reveals how efficiently your team qualifies candidates before the formal interview process begins.
How do you calculate cost per screen?
The formula is: CPS = (Recruiter Time Cost + Tool Cost Allocation + Overhead) ÷ Total Candidates Screened. Use your recruiter's fully loaded hourly rate (base salary × 1.3 ÷ 2,080 hours), multiply by average time spent per candidate at the screen stage, add your proportional tool costs, add a 10–15% overhead buffer, then divide the total monthly screening spend by the total number of candidates screened that month.
Why is cost-per-hire misleading as a standalone metric?
Cost-per-hire is a trailing, funnel-end average. It captures the total spend of a completed search but hides where waste occurred inside the process. A recruiter who screens 300 candidates to make one hire looks identical to one who screened 60 — from a cost-per-hire perspective. It also responds slowly to process improvements, making it a poor signal for real-time optimization. Cost-per-screen exposes inefficiency while it's still actionable.
How much can AI reduce cost-per-screen?
Across industries, AI screening tools typically reduce cost-per-screen by 40–65%. The largest savings come from automating résumé review (which accounts for 40–50% of screening cost) and replacing live initial phone screens with structured asynchronous AI interviews. For high-volume employers and staffing agencies, the absolute dollar savings are particularly significant — often $5,000–$20,000 per month depending on volume and current recruiter compensation.
Is cost-per-screen the same as cost-per-candidate?
They're related but not identical. "Cost-per-candidate" can refer to the total cost across the entire funnel per candidate touched — which would include sourcing, screening, interviewing, and more. Cost-per-screen is specifically the cost at the screening stage only. CPS is more precise and more actionable for evaluating screening efficiency and AI tool ROI.
What are good benchmarks for cost-per-screen by industry?
Benchmarks vary significantly by role complexity and application volume. For logistics and hourly roles: $4–$9 manually, $2–$4.50 with AI. For tech/professional roles: $9–$15 manually, $4–$7 with AI. For staffing agencies processing high volumes: $3–$6 manually, $1.20–$2.50 with AI. These are estimates; your actual baseline will depend on recruiter compensation, tool costs, and average screening time in your organization.
How often should I recalculate cost-per-screen?
Monthly at minimum. CPS shifts with hiring volume, team composition changes, tool additions, and seasonal fluctuation in application quality. If you're evaluating or have recently deployed an AI screening tool, calculate it weekly during the first 60 days so you can demonstrate the impact clearly and adjust deployment if needed.
The metric that changes how you recruit
Cost-per-hire will stay on your dashboard — it's a useful outcome metric, and boards understand it. But if you're serious about building an efficient recruiting operation, cost-per-screen is the number that actually drives decisions. It tells you where your team's time is going, where your tools are adding or failing to add value, and exactly how much you stand to save by deploying AI intelligently.
The teams that start tracking CPS consistently usually find two things: their screening costs are higher than they realized, and the ROI case for AI tools is much cleaner than they expected. When you can show leadership a before/after CPS calculation with an annual savings figure attached, the conversation changes from "is this worth trying?" to "when can we deploy this at scale?"
Run the numbers. Segment by role type. Set a baseline. Then evaluate every process change — especially AI tooling — against whether it moves that number in the right direction.
That's how screening efficiency gets built into the operating model, not just the budget line.
See what AI does to your cost-per-screen
NinjaHire automates résumé review, runs structured AI screens, and delivers ranked shortlists — so your team spends time on candidates who matter. Most teams cut their cost-per-screen by 40–60% in the first month.
Try for free →
.jpg)
.png)